Dashboards
Sloth comes with Grafana ready dashboards to be imported and used.
Detailed SLOs
Get it here
This dashboards features detailed view of each of the SLOs.
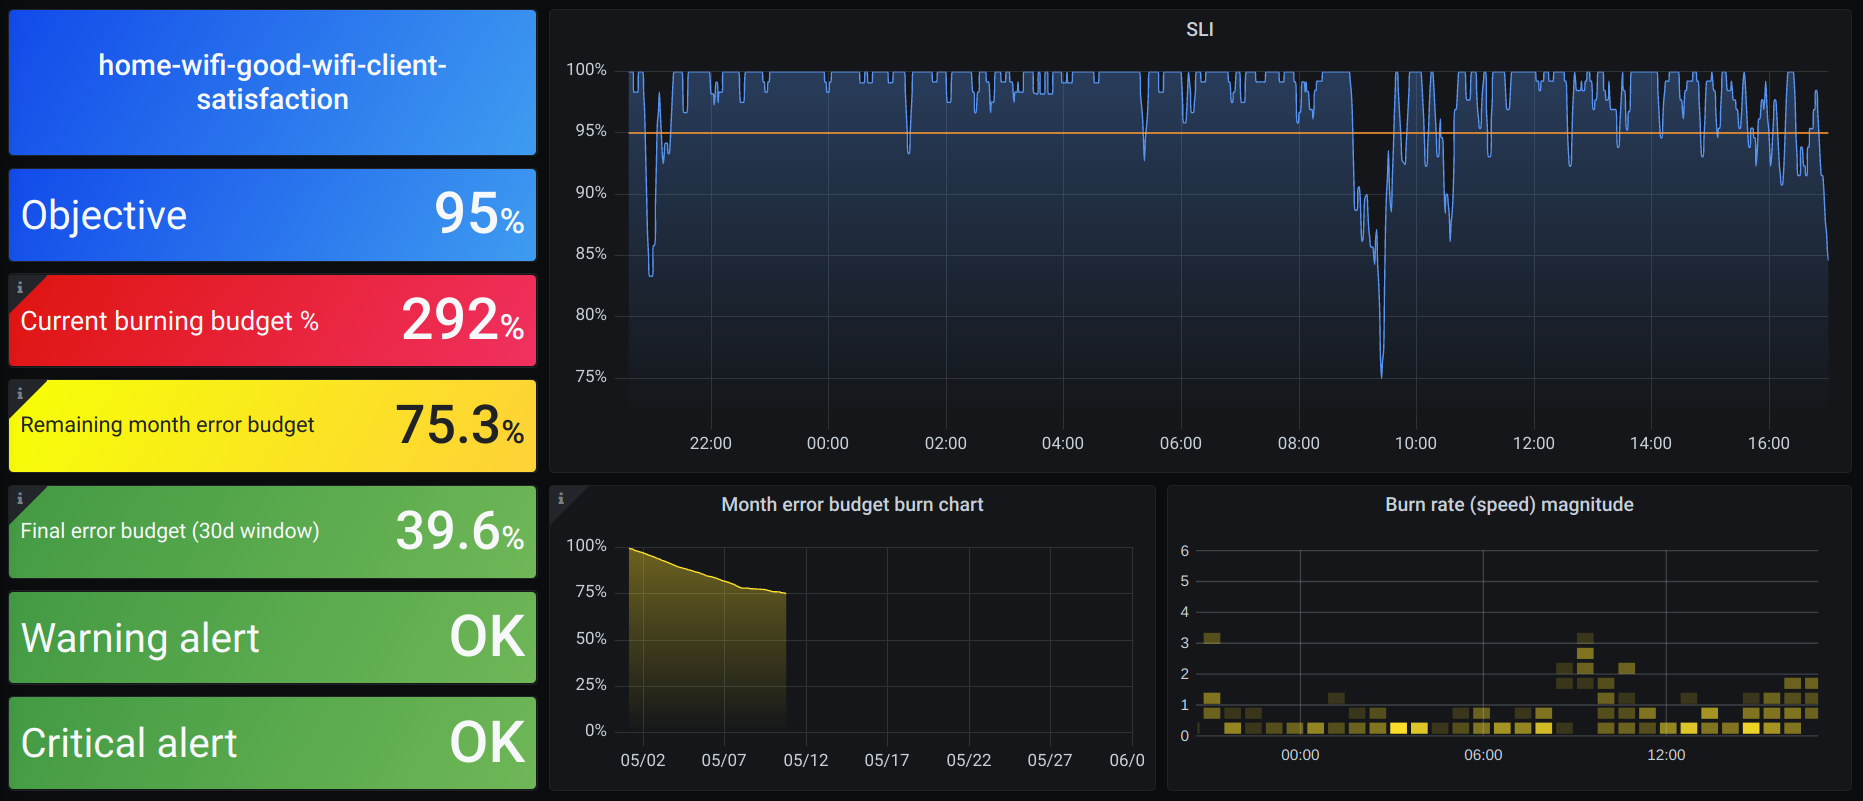
Every SLO will show:
- SLI.
- SLO metadata details (name, objective...).
- SLO Burn rate.
- Remaining error budget for the current month (Since 1st).
- Remaining error budget for the last 30 days.
- In case of enabled alerts, show the state of the current alerts.
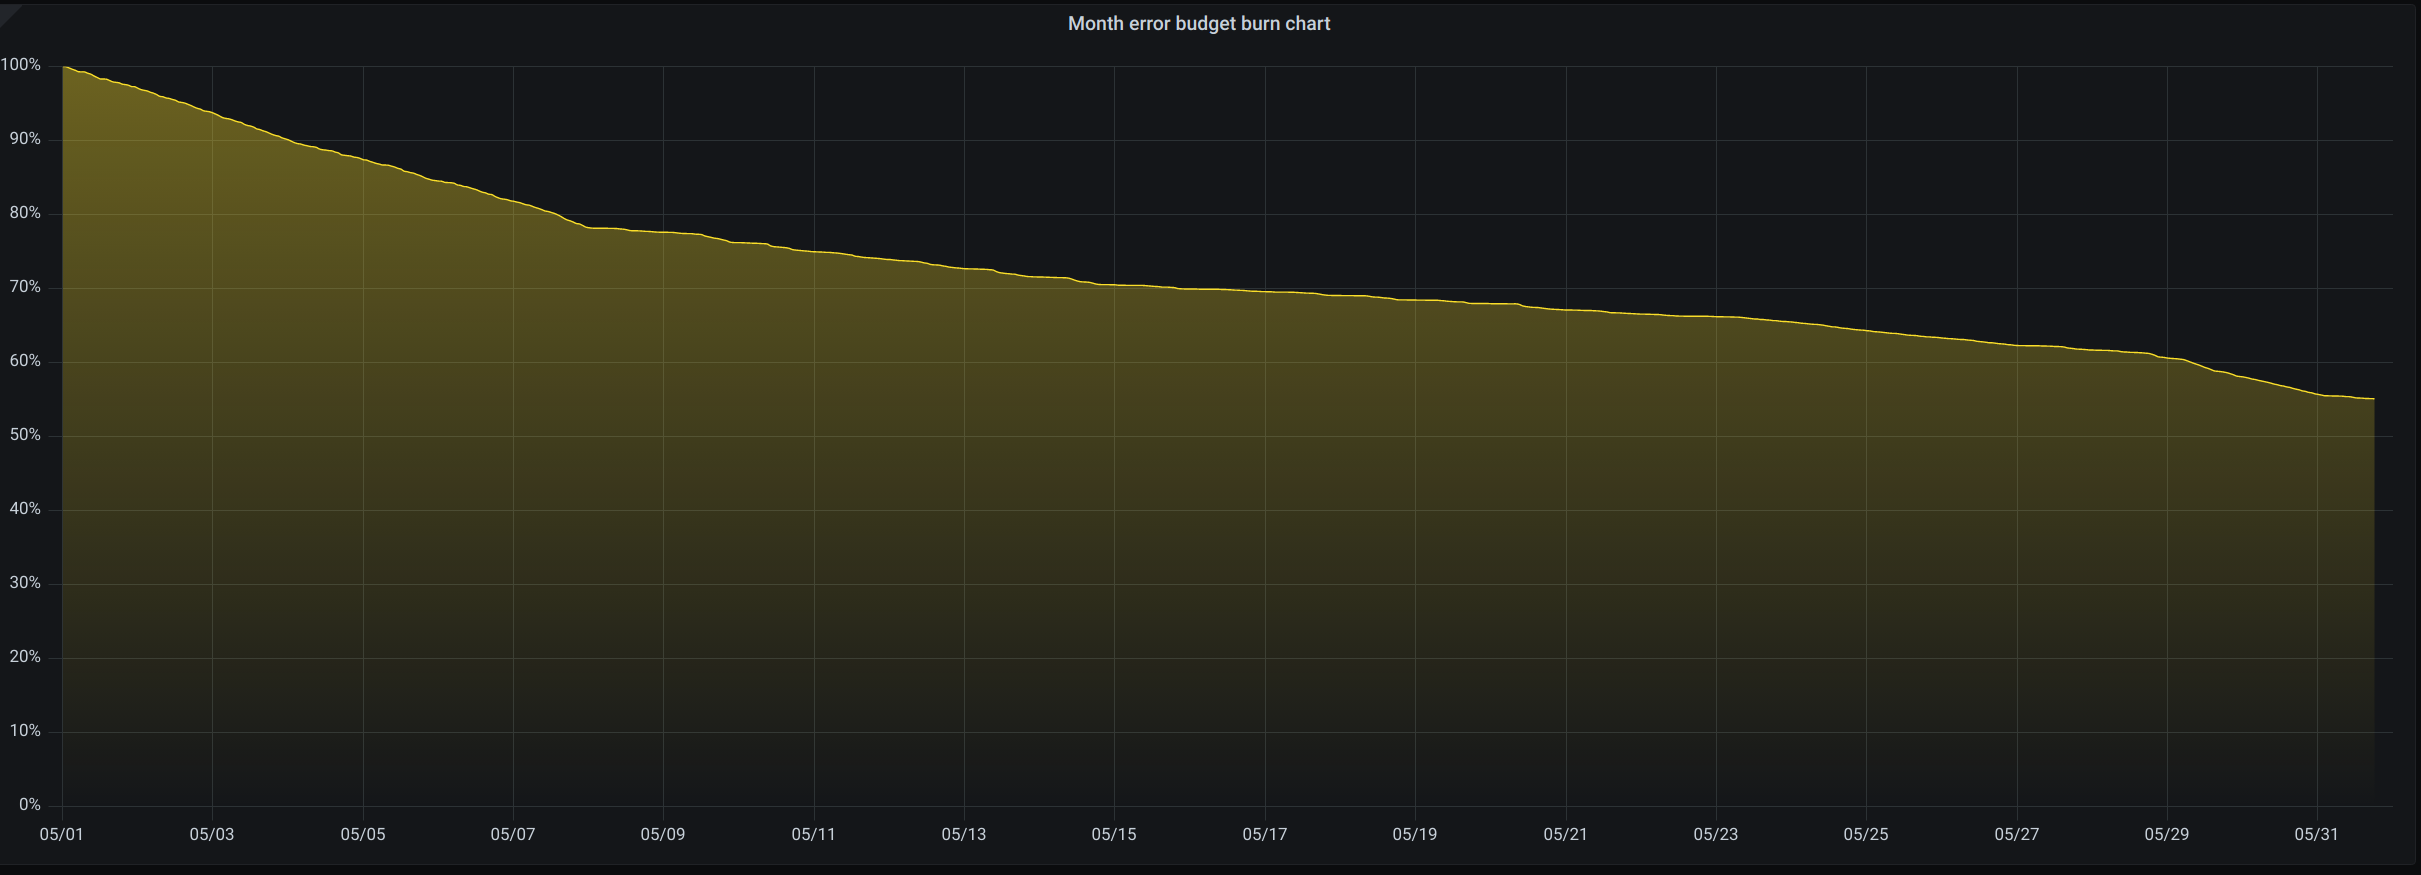
- Error budget month burndown chart.
- Burn rate magnitude.
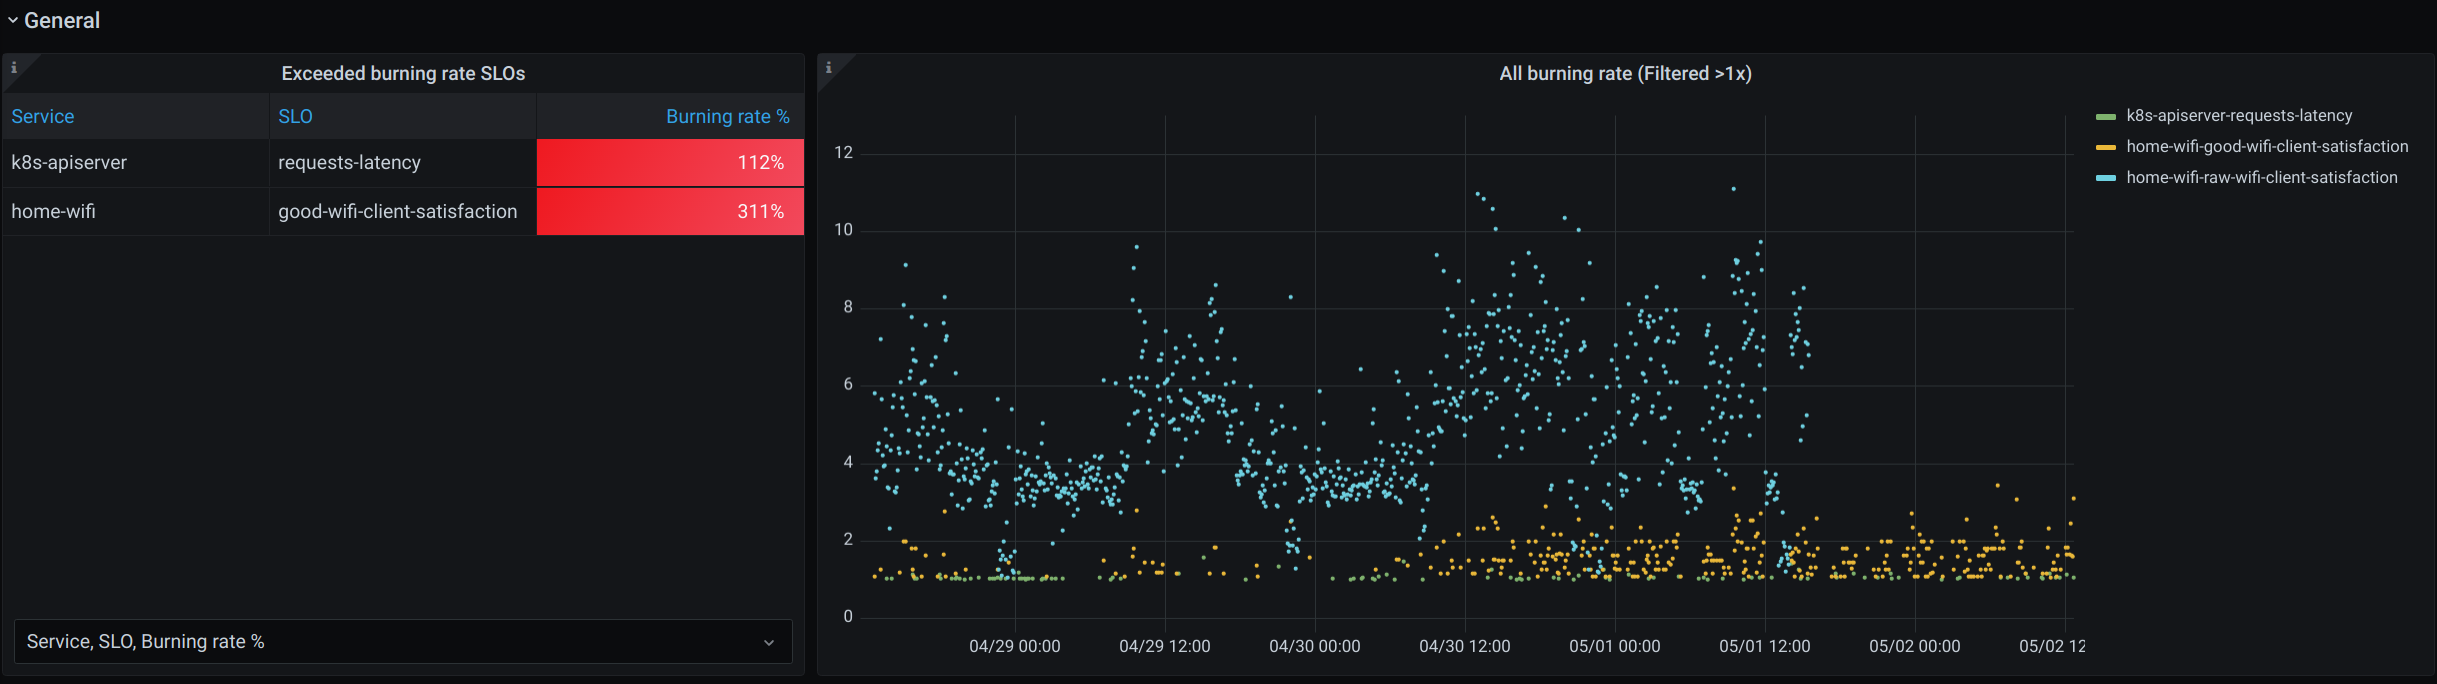
Apart from this, the dashboards has a general view of the current exceeded SLO list and graph.
High level overview
Get it here
This dashboards shows a high level overview of all the SLOs in the system managed by sloth. Normally this dashboards will be used to check correlation between SLO error budget burns.
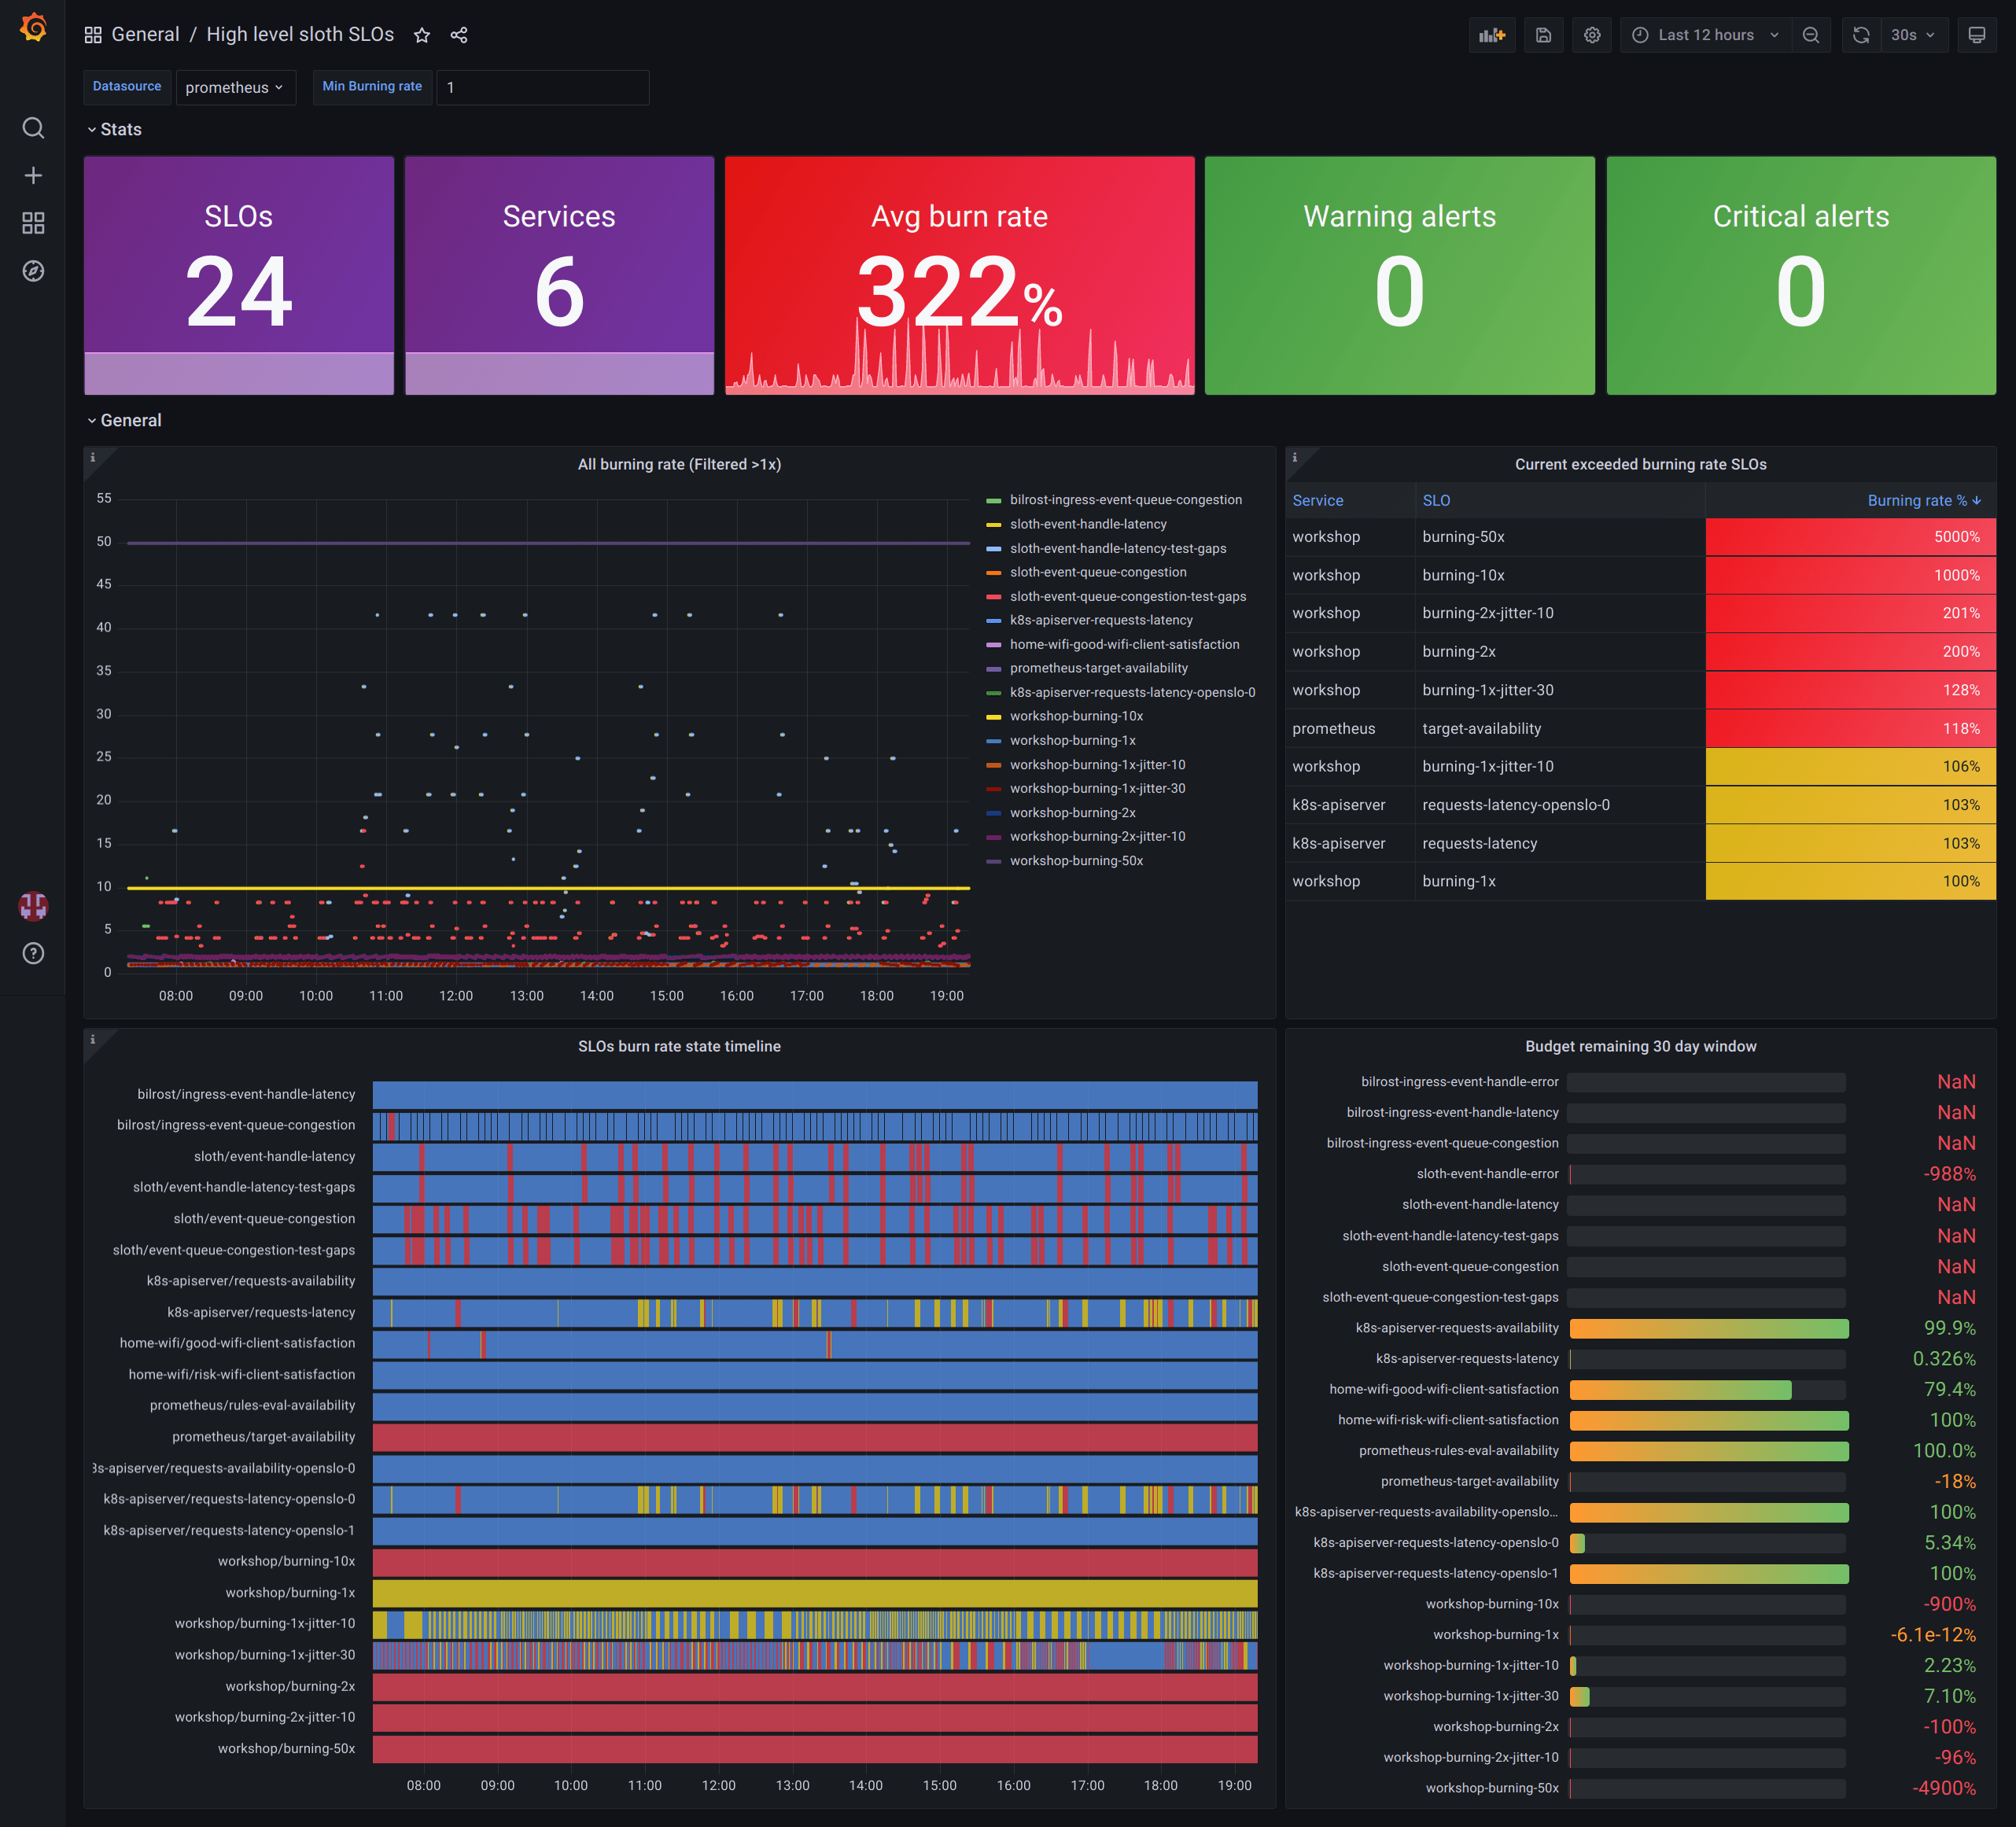
This dashboards comes with:
- Information of SLOs (quantity, average burn rate of all, triggering alerts...).
- Graph and tables of the SLOs currently burning budget at high rates.
- Timeline with all SLOS error budget burns.